Spotify screensaver attempt #2 made on Way Out West hack 2013 Gothenburg

About 8 months ago me and my friend Jocke did a screensaver for Spotify, based on an idea I had blogged about earlier. The main idea circles around the web player version of Spotify, because it’s the only way we’ve figured out how to do full screen apps. Our last attempt was a bit of a failure, because nothing was animating (which makes for a really bad screensaver). So during Way Out West I gave it another try, this time with Johan and Jonas who I’ve made Spelkalendern with.

Early we concluded that web app was the only way, again. So we changed our bookmarklet into a Chrome extension. As a little cute trick, the Chrome extension automatically adds a “hack” button to the page when you visit the player. When clicked it opens our app and hacks the iframe around it to allow fullscreen.

Chrome extension that adds this button to the Spotify web player.
Now as Chrome plugin

We really should change it to allow any app to go fullscreen. Hmmm…

We had one small problem though. The app SDK for the web player was no longer supported! It took a few hours to hack around it but we were able to solve it by changing the local server a bit.

Last time we mucked around with WebGL and that slowed us down. So this time it was simple HTML and CSS for the styling. We went with a clean look that’s very appealing. Using a service to get cool desktop sized artist photos and then the regular album art of the upcoming songs.

Since it was coded very modular, we could have a view to show various playlists to start with but we could also visualize anything you’re playing (like search results or just start playing inside some artist page). This was useful at my party last weekend.

Spotify screensaver #2 running on my TV through Apple TV

Update: See version 3 of this project.

Spotify screensaver made on Music Hack Day 2013 Stockholm

Some time ago I blogged about an idea of making a Spotify screensaver. This weekend at the MusicHackDay in Stockholm me, Jocke and Vincent finally tried our hands at doing this by creating PartySaver. The first quest was: How do we play music and show music info, in fullscreen?

There’s several ways to play Spotify music: Spotify players (Win, Mac, iOS, etc), Spotify web player, and libspotify. We opted for the web player, but a developer edition which supports apps. We quickly noticed the apps aren’t allowed to run in fullscreen! So we created a bookmarklet that “hacks” the player to allow fullscreen apps.

Then I focused on the new 1.0 API to get the users playlists, and then the tracks from that playlist. While Jocke spent most of his time on WebGL and three.js so we could have the cover arts in a 3D mosaic that would animate and move. Sadly, we never got that far. Regardless, it went pretty good and we’re happy – so we’re going to try a CSS3 version. If we make it, we might even have a sponsor for a real screensaver. The question is, how should it be done?

Update: See version 2 and version 3 of this project.

Project: Read It Later Dashboard Prototype

Me and @bennedich decided to make a prototype of the Reading Statistics idea while keeping it fully hosted in Dropbox. That means pure HTML, CSS and JavaScript (although we wrote the JS using CoffeScript). For fancy graphs we picked Google Chart Tools. Here’s a shot of the final prototype:

Screenshot of the RIL-Dashboard prototype

First we took a look at what the ReadItLater API offered, as we both use the service for our reading. It’s fairly simple and just gives you a list of all the articles, where each article has:

  • Item ID: unique id identifying the url
  • URL: the article url
  • Title: page title
  • Time updated: Unix timestamp of when the item was last added/changed
  • Time added: Unix timestamp of when the item was added to list
  • Tags: user entered, comma-seperated
  • State: read or unread

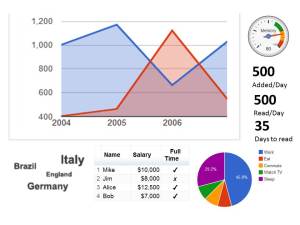
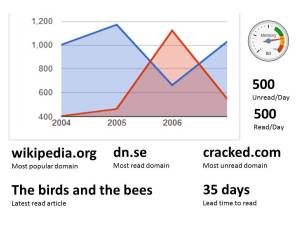
We thought of a few specific stats we could easily calculate and drew some sketches. Basically some kind of big line chart, and then some numbers around it.

Then we looked at all the chart types provided by Google, grabbed screenshots of them, and ordered them into potential dashboards.

For our first prototype we picked the easiest one just to get all the pieces in place. A simple bar-type distribution chart of how many articles are read after a set amount of time (i.e. X articles on the same day, Y after 1 day, Z on after 2 days, etc). The three main numbers below the chart were average articles added per day, average read per day, and average time between adding an article and reading it.

Parsing and calculating the stats was the easy part. A problem we have is that RIL doesn’t support JSONP. To get around that we used Yahoos YQL service. A potential new project would be a JSON tunnel.

Finally we added a small login-screen, on the same page, put the data in the REST-call and blam! Done!

Now, try it out!